Researchers at the University of Colorado Anschutz (CU Anscutz) have developed frameworks and software tools to help elucidate the complexities of pediatric blood pressure—accounting for vital factors including age, sex and height
Many people learn the familiar shorthand that “healthy blood pressure” means staying below 12/80 mmHg. However, blood pressure—especially in children—is far more complex than this.
Instead of relying on shorthand, researchers and clinicians working with children can use percentile charts known as pediatric blood pressure percentiles (BPPs). These BPPs are vital because they are used in the diagnosis of several conditions, including hypertension and shock. Yet BPPs sometimes lack important information and don't always account for all of the relevant variables.
To address these challenges, a team of researchers including Peter DeWitt, PhD, assistant research professor of biomedical informatics developed pedbp: a comprehensive tool that supports researchers and clinicians to access and understand blood pressure percentiles while accounting for variables including age, sex and height.
This is the fifth installment in our ongoing series spotlighting the DBMI Wall of Software, an interactive online hub showcasing the latest open-source software and data tools for researchers. View the Wall of Software here.
To learn more about pedbp and its applications, we sat down with DeWitt.

What is pedbp?
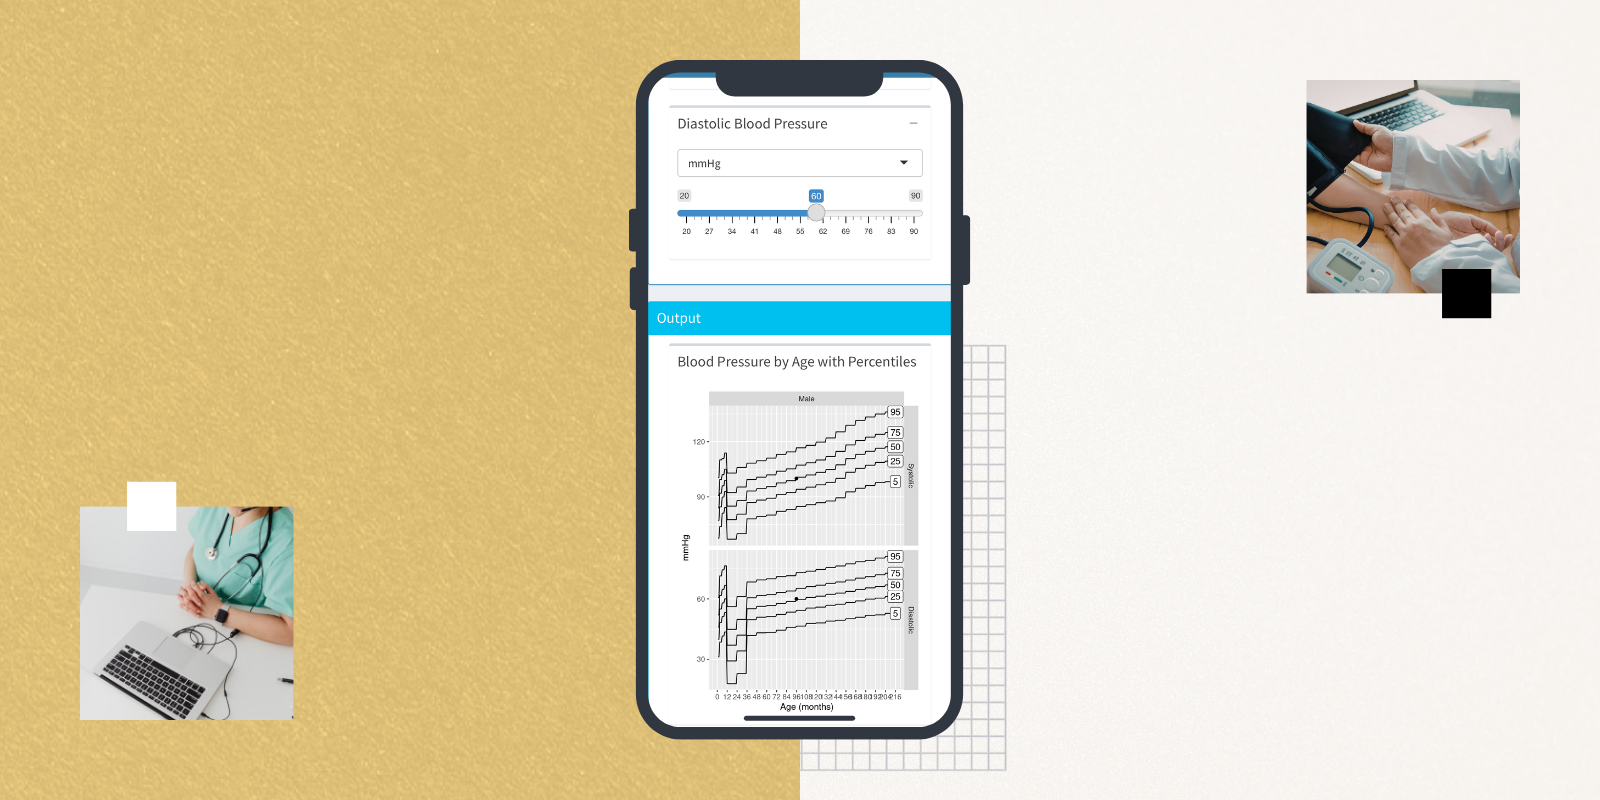
pedbp is a software tool that can be used to consistently estimate BPP estimates based on age, sex and stature (known or unknown). pedbp includes the pedbp R package for researchers working in R, as well as a pedbp shinyapp that leverages a code-free user interface in a web browser (no download required).
Why did you create pedbp?
Blood pressure in pediatrics is not the 120/80 that we all learned as shorthand for what’s ‘healthy’ for adults. It’s a function of sex and age, as well as other variables.
We developed pedbp as a way to ‘harmonize’ blood pressures. This tool helps us understand blood pressures on a percentile basis while accounting for age and sex (as well as stature), which is helpful for research and diagnosis.
One of the main benefits of pedbp is that it offers a consistent method to access and implement BPPs. This creates a reliable system that can be reused time and time again.
How did you decide to create pedbp?
The spark that led to my idea for pedbp began with a research study conducted Blake Martin, MD, an intensivist at Children’s Hospital Colorado (CHC). In one of his studies, he needed to account for blood pressure in very young pediatric patients. So Martin wrote a literature review, and he found a bunch of tables from the Center for Disease Control (CDC), the World Health Organization (WHO) and a variety of other sources. Initially, there were some percentile ranges missing, so he found other sources to fill those. By synthesizing the sources, he was able to fill gaps that existed across different BPPs.
So, a very useful dataset had been created, and there was a thought that it was a useful dataset—so it should become more than just a side note in a methodology section. So I was approached with the task create a shinyapp web application to get the data and information out there. I decided to build a full package, so I built the the pedbp R package, and in the process I created the pedbp shinyapp that was built on the same functionality as the package. Then, we published a paper about the pedbp tool.
What challenges arose in the creation of pedbp?
The biggest challenge was making some assumptions and justifying them. For example, a lot of the reference tables only reported the top 50% blood pressure values. So, maybe just the median was reported, along with the 70th, 80th, 90th and 95th percentiles. It makes sense, because those tables came from sources that were focused on elevated blood pressure, but we wanted the package and tool to also be able to address hypotensive conditions. So we built assumptions based on an optimized distributional form that would match well to the published percentiles.
Who can benefit from pedbp?
Any person doing research in pediatrics where the cardiovascular system is a consideration or concern can benefit from the pedbp tool.
In addition, intensivists / intensive care clinicians should be aware of this tool (especially the shinyapp) because it elucidates the complexities of pediatric blood pressure in a fast, reliable method.
Where can someone find the pedbp tool(s)?
The pedbp R tool is available on the comprehensive R archive network (CRAN). The R tool can also be accessed from the pedbp website, the pedbp Github repository or through the Department of Biomedical Informatics (DBMI) Wall of Software.
The pedbp shinyapp is available at https://dewittpe.shinyapps.io/pedbp/, and can be accessed easily through an internet browser without any required downloads. Instructions for use of the pedbp shinyapp can be found here.