You may have learned the simple rule that healthy blood pressure is “under 120/80 mm Hg,” but pediatric blood pressure is far more nuanced. Clinicians and researchers rely on pediatric blood pressure percentiles (BPPs) to diagnose conditions such as hypertension and shock, yet existing percentile charts can be hard to access, inconsistent or incomplete.
To address these challenges, researchers at the University of Colorado Anschutz (CU Anschutz) developed pedbp, a set of tools designed to standardize and clarify pediatric blood pressure percentiles using key variables like age, sex and height. Leading the effort is Peter DeWitt, PhD, assistant research professor of biomedical informatics.
The pedbp shinyapp is a user-friendly implementation of the pedbp package that is formatted as a web application. This tool allows clinicians, researchers or anyone else to explore blood pressure percentiles without needing to write code or download software. Read on to see how to use the pedbp shinyapp to map and visualize pediatric blood pressure percentiles.
This is an instructional installment highlighting an application of the pedbp tool for pediatric blood pressure. This is part of our ongoing series spotlighting the DBMI Wall of Software, an interactive online hub showcasing the latest open-source software and data tools for researchers. View the Wall of Software here.
To learn more about pedbp and its applications, we sat down with DeWitt.
-
Navigate to the pedbp shinyapp homepage, and in the navigation (three lines) select Blood Pressure.
.png?width=540&height=540&name=pedbp_shinyapp_pictures%20(2).png)
-
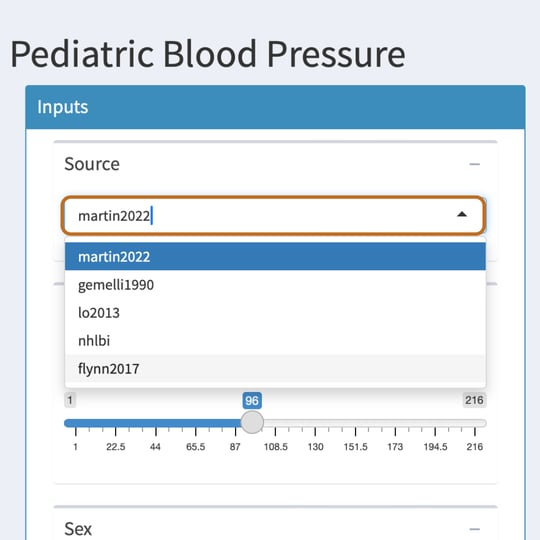
The Source dropdown allows you to select the source study for which percentile ranges will be used in the calculations.
Citations for these sources can be found in the References section of the pedbp shinyapp homepage.
-
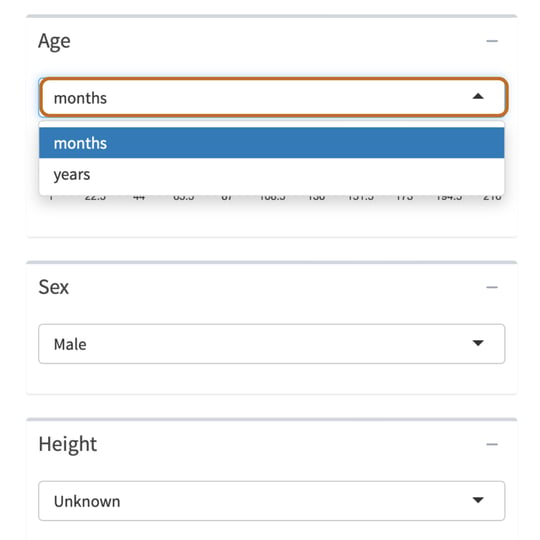
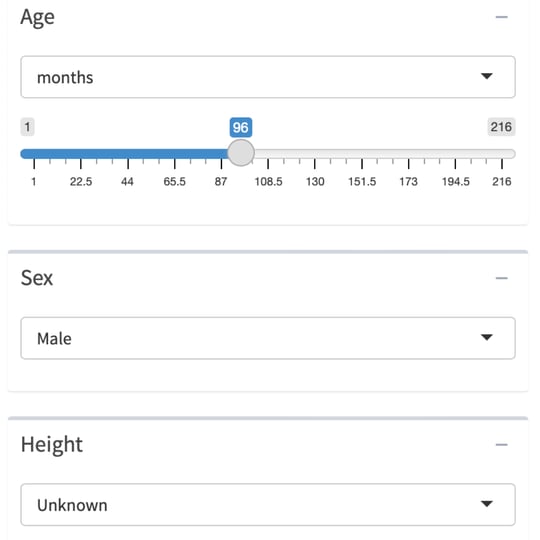
Select the child’s Age.
The age dropdown allows users to select age by either months or years, making it easier to work with infant datasets.
-
Select the child’s Sex and Height.
Height can be left as Unknown, or it can be selected as Known and adjusted based on centimeters (cm), inches or percentile range.
-
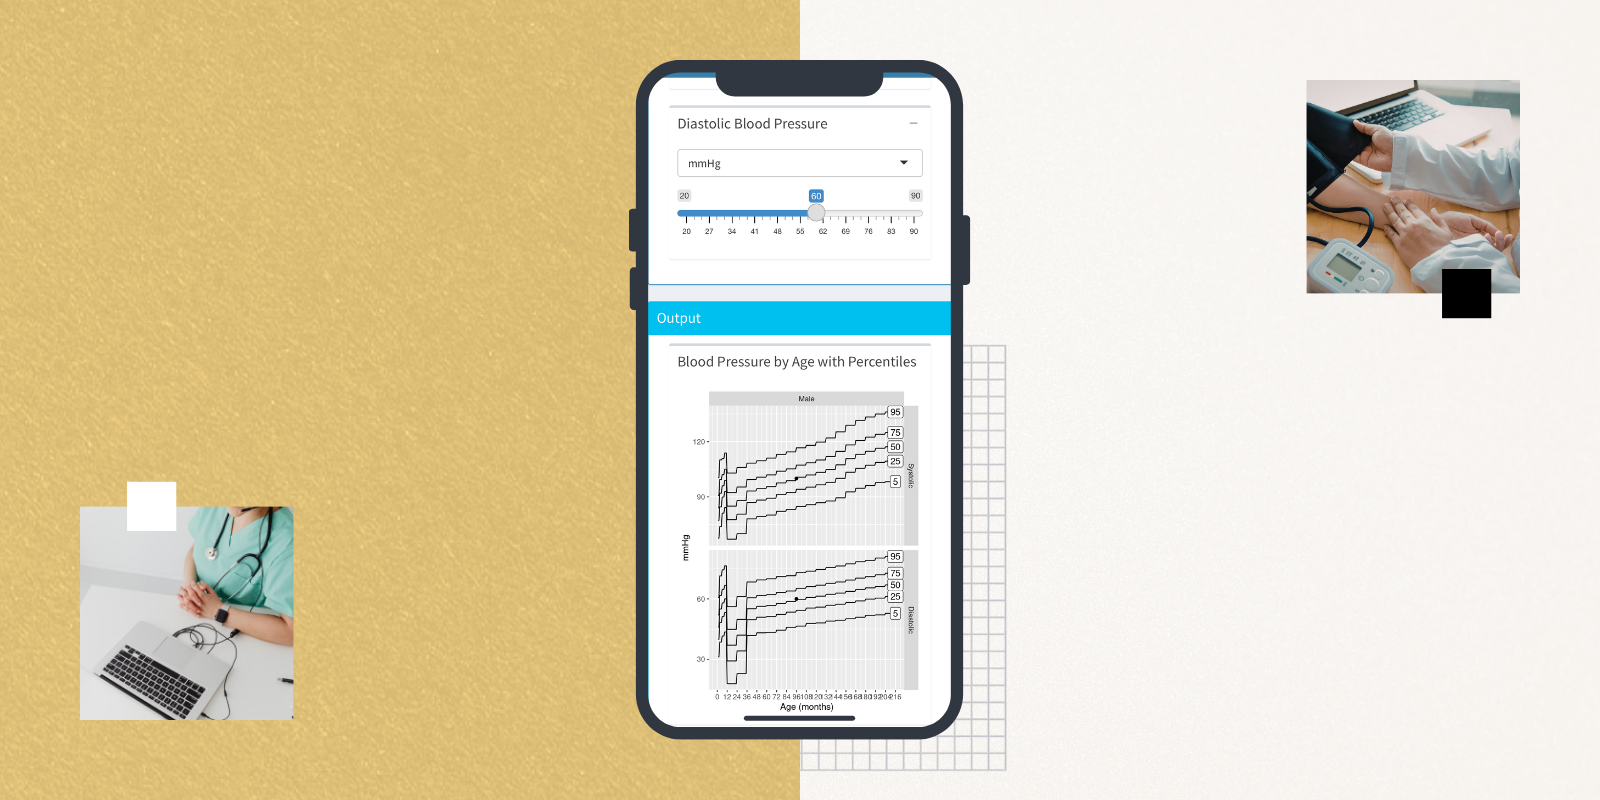
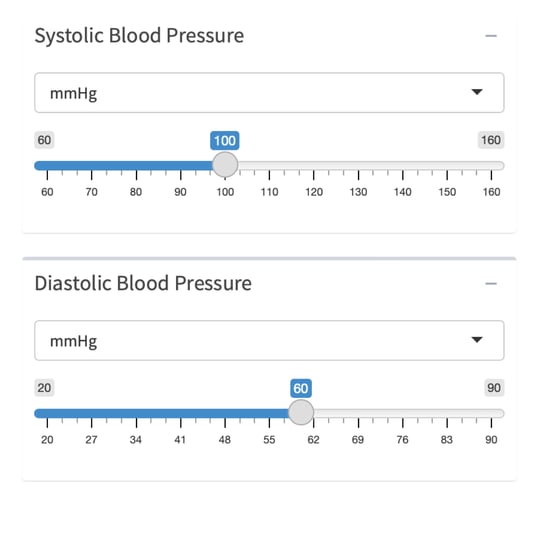
Select the child’s Systolic Blood Pressure and Diastolic Blood Pressure.
The dropdown can be used to enter blood pressure values either by Millimeters of Mercury (mmHg) or percentile range.
-
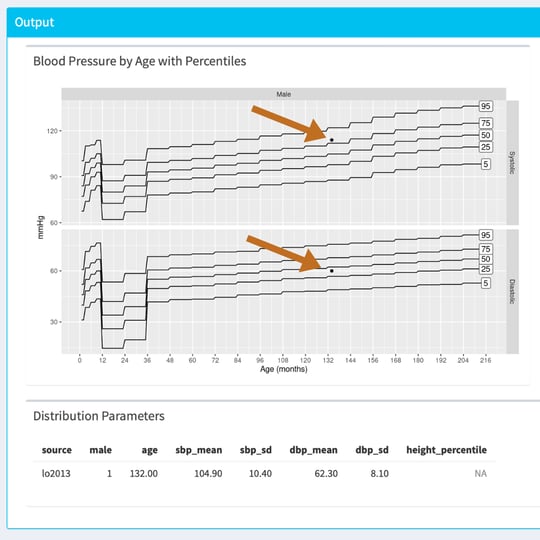
View the outputs and charts. Outputs are automatically adjusted as variable selections are made.
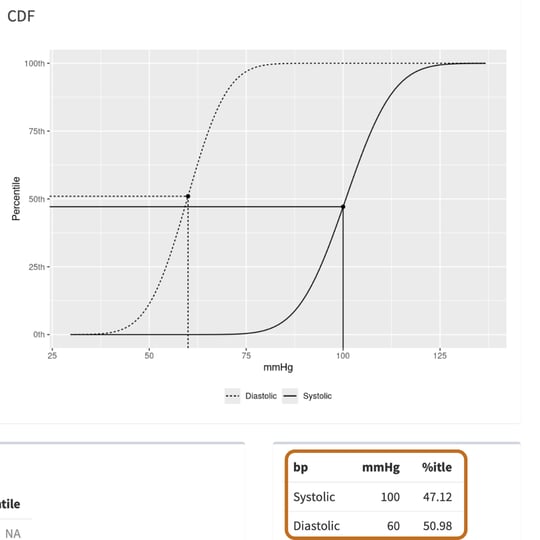
The blood pressure of the child will be shown as a small black dot, which is illustrated against the percentile ranges (based on the initial Source selection). Users can view charts that demonstrate the percentiles for both Systolic and Diastolic blood pressure, or they can view a Cumulative Distribution Function (CDF).
.png?width=540&height=540&name=pedbp_shinyapp_pictures%20(1).png)
-
The precise percentiles can also be viewed in the output chart.